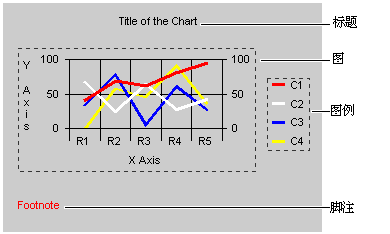
MSChart控件有许多可视的部件,它们均可以编程。要掌握这写是如何实现的,可以考察下图,它说明了图表的各部分。

其中的每一部分在 MSChart 控件中都有一个相应的对象,通过这个对象可以改变图表中几乎任一元素的格式。例如,下面代码通过改变 Plot 对象的颜色显著地改变了图表的外观。
Private Sub cmdFormat_Click() '首先,将图表类型改为3D图表'这样可以看到图的所有部分。MSChart1.chartType = VtChChartType3dArea'用Plot对象将'背景变为浅蓝色。With MSChart1.Plot.Backdrop'除非将样式属性正确地设置为VtFillStyleBrush'否则不会有颜色显示。.Fill.Style = VtFillStyleBrush.Fill.Brush.FillColor.Set 100, 255, 200'添加边框。.Frame.Style = VtFrameStyleThickInner'将样式设置为显示阴影。.Shadow.Style = VtShadowStyleDropEnd With'将绘图墙的颜色设置为黄色。With MSChart1.Plot'将样式设置为实心。.Wall.Brush.Style = VtBrushStyleSolid'将颜色设置为黄色。.Wall.Brush.FillColor.Set 255, 255, 0End WithWith MSChart1.Plot '将绘图底色设置为蓝色。.PlotBase.BaseHeight = 200.PlotBase.Brush.Style = VtBrushStyleSolid.PlotBase.Brush.FillColor.Set 0, 0, 255End WithEnd Sub
一种与字体有关的基本情况是设置标题的文本。要做到这一点,需要正确使用 Title 对象的 Text 属性:
MSChart1.Title.Text = "Year End Summary"
这很简单。下一个问题是怎样改变字体的属性。
为了格式化图表上所有文本的属性,必须使用 VtFont 对象。例如,要格式化标题,可以使用如下代码:
With MSChart1.Title.VtFont
   .Name = "Algerian"
   .Style = VtFontStyleBold
   .Effect = VtFontEffectUnderline
   .Size = 14
   .VtColor.Set 255, 0, 255
End With
对图表的其它部分也可以使用同样的技术。唯一的不同在于对象模型。例如,要格式化 Legend 区域的文本属性,可使用如下代码:
MSChart1.Legend.VtFont.Size = 18
要改变图的比例,必须通过修改图表的 y 轴来实现(改变 x 轴看不到什么影响)。一种改变比例的方便途径是使用 ComboBox 控件,如下面代码所示:
Private Sub Form_Load() '设定一个名为cmbScale的组合框。With cmbScale.AddItem "Log".AddItem "Percent".AddItem "Linear".ListIndex = 0End WithEnd SubPrivate Sub cmbScale_Click()'组合框有三个项目:Log,Percent,'和Linear(缺省比例)。Select Case cmbScale.TextCase "Log"MSChart1.Plot.Axis(VtChAxisIdY) _.AxisScale.Type = VtChScaleTypeLogarithmic'从scale转换到log时必须特别'指定一个LogBase。基数可以设为' 2到200间的任意值。MSChart1.Plot.Axis(VtChAxisIdY).AxisScale _.LogBase = 10Case "Percent"MSChart1.Plot.Axis(VtChAxisIdY).AxisScale _.Type = VtChScaleTypePercent'设置PercentBasis为六种类型中的一种。'为了方便,只列出一种。MSChart1.Plot.Axis(VtChAxisIdY).AxisScale _.PercentBasis = VtChPercentAxisBasisMaxChartCase "Linear"MSChart1.Plot.Axis(VtChAxisIdY).AxisScale _.Type = VtChScaleTypeLinearEnd SelectEnd Sub
有时可能想要允许用户使用 CommonDialog 控件选择颜色分配给图表元素(如系列的颜色)。在这种情况下,可以使用如下的函数,它们对 CommonDialog 控件的 Color 属性返回的字节进行屏蔽,进而获得 Set 方法所需的单独的红、绿、蓝的值。
'将这些函数粘贴到Form或Code'模块的Declarations部分中。Public Function RedFromRGB(ByVal rgb As Long) _As Integer' &HFF后的“&”符号将数字强制'为长整型,防止Visual Basic'将其视为负值。逻辑And操作用'来返回位值。RedFromRGB = &HFF& And rgbEnd FunctionPublic Function GreenFromRGB(ByVal rgb As Long) _As Integer' And操作的结果是除以256,'以便返回中部字节的值。'注意整型除数的用法。GreenFromRGB = (&HFF00& And rgb) \ 256End FunctionPublic Function BlueFromRGB(ByVal rgb As Long) _As Integer'此函数和上面的GreenFromRGB函数'功能相似,除了不需要使用“&”符号。'数字已经是长整型了。结果除以65536'以便得到最高的几位字节。BlueFromRGB = (&HFF0000 And rgb) \ 65536End Function
通过使用前面例子中的函数,可以得到 CommonDialog 对象返回的长整型值,并且可以设置 MSChart 对象的颜色。下面的例子允许通过双击一个序列来改变其颜色:
Private Sub MSChart1_SeriesActivated(Series As _ Integer, MouseFlags As Integer, Cancel As Integer) ' CommonDialog控件被命名为dlgChartDim red, green, blue As IntegerWith dlgChart ' CommonDialog对象.ShowColorred = RedFromRGB(.Color)green = GreenFromRGB(.Color)blue = BlueFromRGB(.Color)End With'注意:只有2D和3D线图使用Pen对象。'所有其它类型均使用Brush。If MSChart1.chartType <> VtChChartType2dLine Or _MSChart1.chartType <> VtChChartType3dLine ThenMSChart1.Plot.SeriesCollection(Series). _DataPoints(-1).Brush.FillColor. _Set red, green, blueElseMSChart1.Plot.SeriesCollection(Series).Pen. _VtColor.Set red, green, blueEnd IfEnd Sub